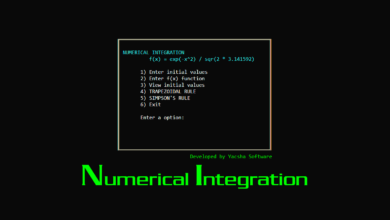
Plotting Mathematical Functions, 2d function plotter in C++ (Graf XY), using graphics.h BGI library
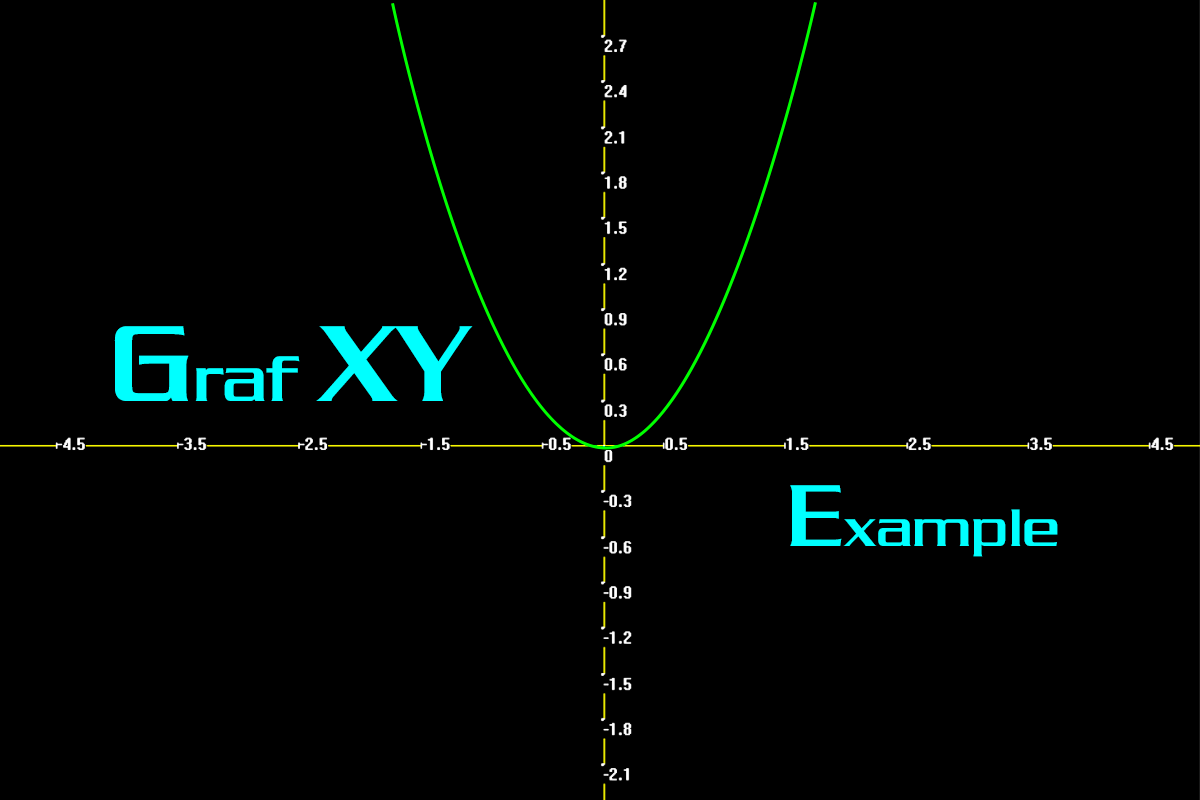
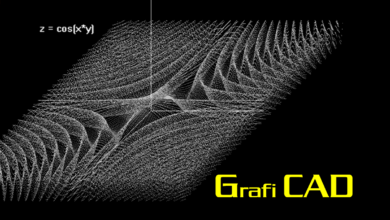
Plots points of a two-dimensional function (y = f(x)) on the screen, in the specified region of the Cartesian plane.
This plot is done in a rectangular frame window of any dimension (can be smaller than the screen).
Plots points of a two-dimensional function (y = f(x)) on the screen, in the specified Cartesian plane region.
This plot is done in a rectangular frame window of any dimension (can be smaller than the screen).
This program is made with the powerful CRegionXY class, which makes you forget the tedious work of transforming real coordinates to integer coordinates to plot the function.
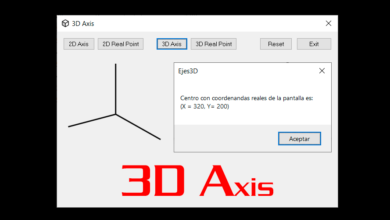
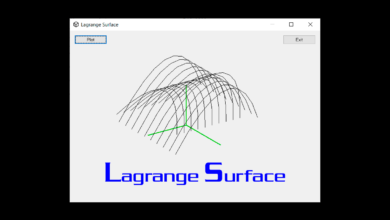
The Cartesian axes can be viewed by calling a single function.
The graph of a parabola is included as an example.
Developed by:
YACSHA – Software & Desing, since 1999, Lima – Perú
The World of Chaos – EL MUNDO DEL CAOS – Unlimited Programming
You can DOWNLOAD the SOURCE CODE and executable software for FREE from here:
Graf XY (13204 downloads )Join The World of Chaos Developer Community😃
Contribute to the project on Github!HISTORY
- Version 2 – 21-III-2024
- Update graphics/gxydemo – Porting to VC++ 2017 using winbgi