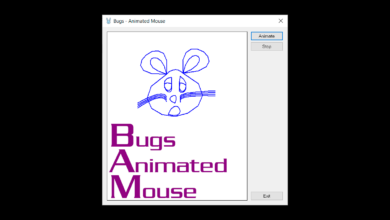
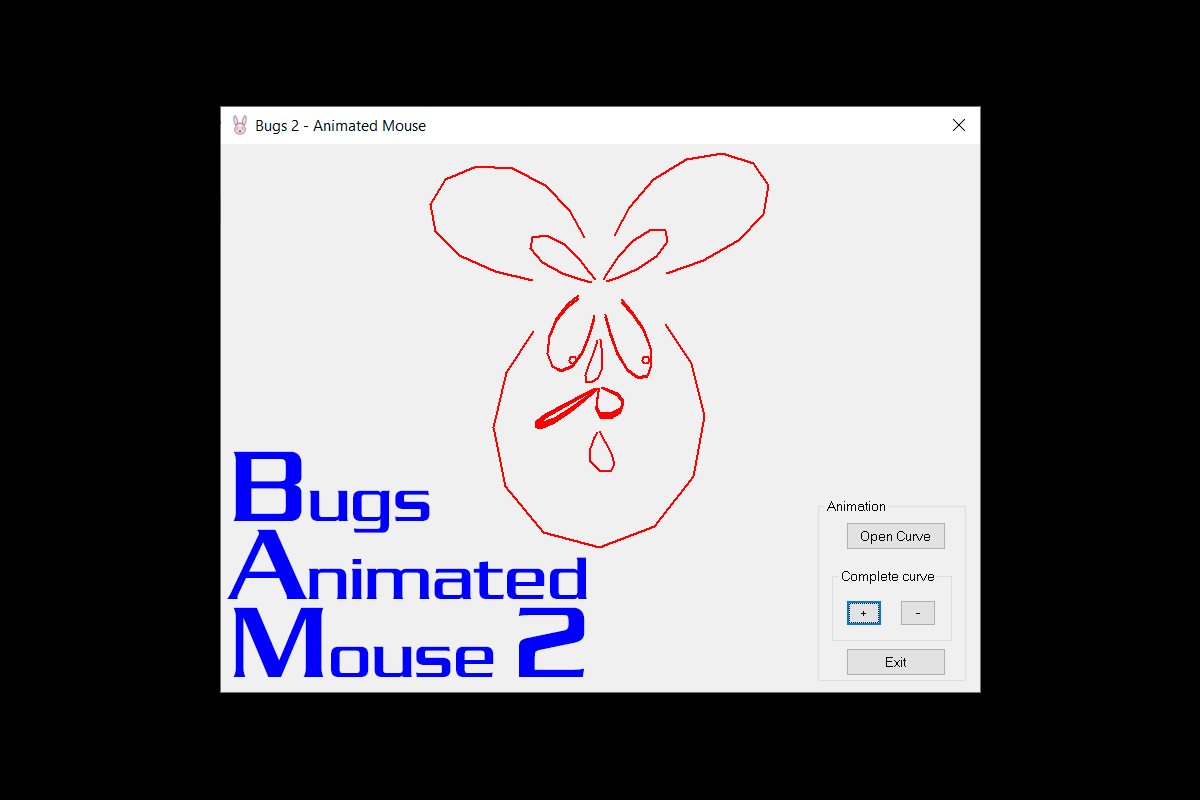
Another style of drawing Bugs:
Draws a mouse’s face using Bezier curves, and then animates the mouse’s face, like a cartoon.
Spanish:
Otro estilo de dibujar a Bugs:
Dibuja la cara de un raton usando curvas de Bezier, y luego se anima la cara del ratón, como un dibujo animado.
Developed by:
Original authors: Amelia
Improvements added from version 2, thanks to Yacsha.
YACSHA – Software & Desing, since 1999, Lima – Perú
The World of Chaos – EL MUNDO DEL CAOS – Unlimited Programming
You can DOWNLOAD the SOURCE CODE and executable software for FREE from here:
Join The World of Chaos Developer Community😃
Contribute to the project on Github!HISTORY
- Version 2 – 03-V-2024
- Thanks to the collaboration of a follower of “the world of chaos”, we obtained the first version. From which we have made the following changes:
- Update visual-c++\Bugs-MouseAnimated – Porting to VC++ 2017.
- Added mouse face icon
- Update format code
- Various bugs are corrected, which do not allow correct mouse animation.
- A frame with a white background is added, to better show the animation, and to eliminate the bug that caused the buttons to disappear when starting the animation
- Thanks to the collaboration of a follower of “the world of chaos”, we obtained the first version. From which we have made the following changes:
- Version 1 – 02-VI-2000
- First version developed by Amelia